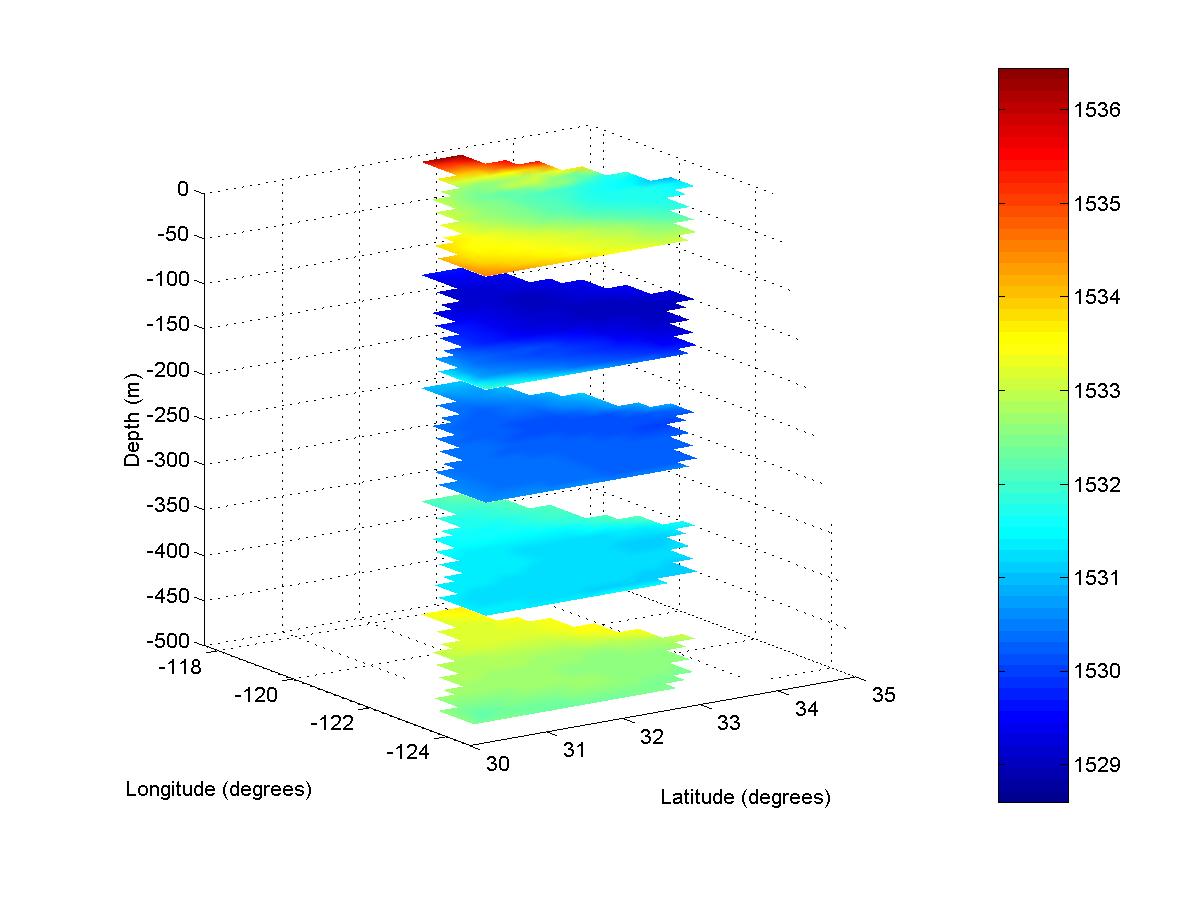
 Output of plotssp showing SSP structure.
Matlab code, plotssp.m, used to render the sound speed profile.
Output of plotssp showing SSP structure.
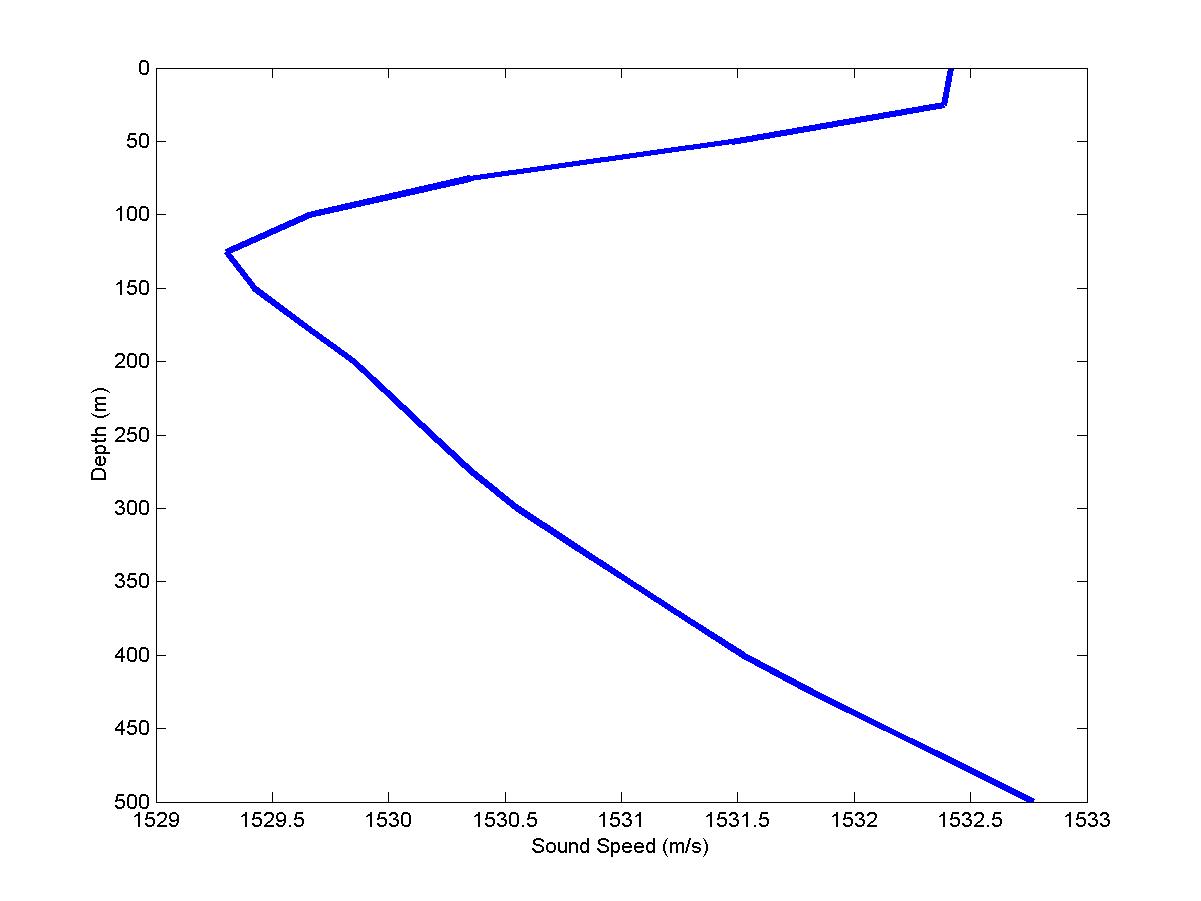 Sample range-independent profile extracted from the middle of the field
Input file (or envfil) used by BELLHOP to generate the ray trace.
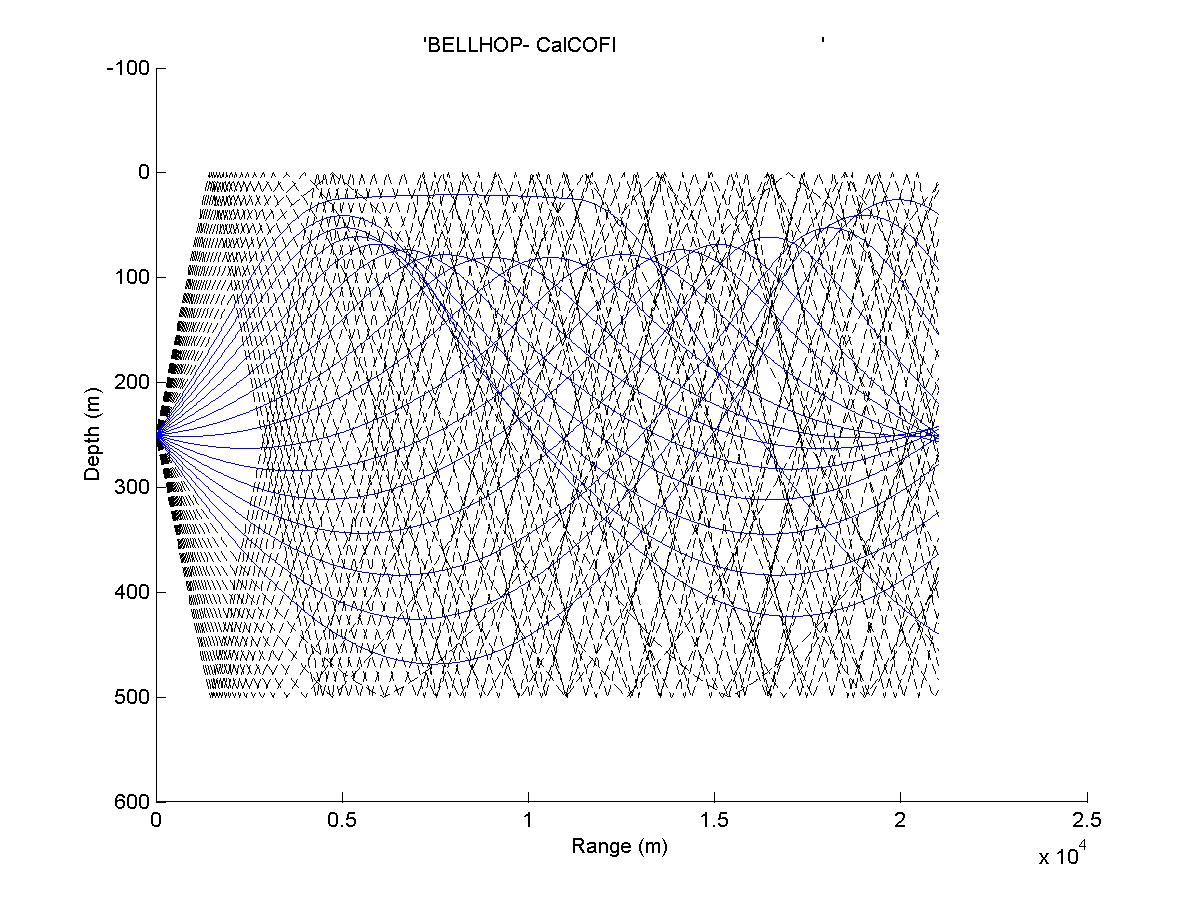 Ray-trace calculated by BELLHOP for a source at mid-water depth
Input file (or envfil) used to generate the TL.
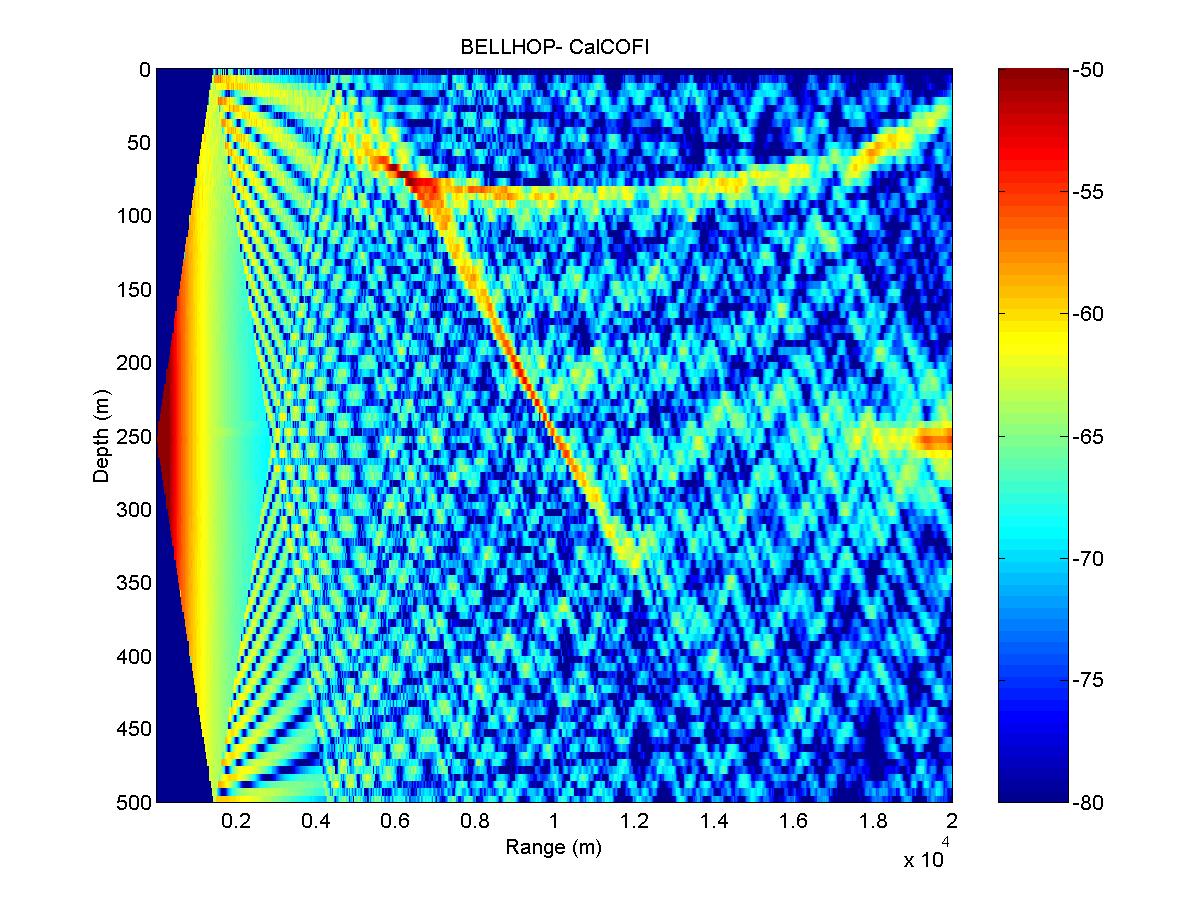 Transmission loss calculated by BELLHOP for a 400 Hz source at mid-water depth.
Matlab code used to generate the source waveform, make_source.m (an LFM centered at 400 Hz as described in Bob Gisiner's summary above). The source level is -6 dBFS so that the waveform has a reasonable amplitude in the '.wav' format.
Source waveform in 'wav' format as spec'd by the committee (see "Description" above)
Input file (or envfil) used to generate the arrivals file (arrfil).
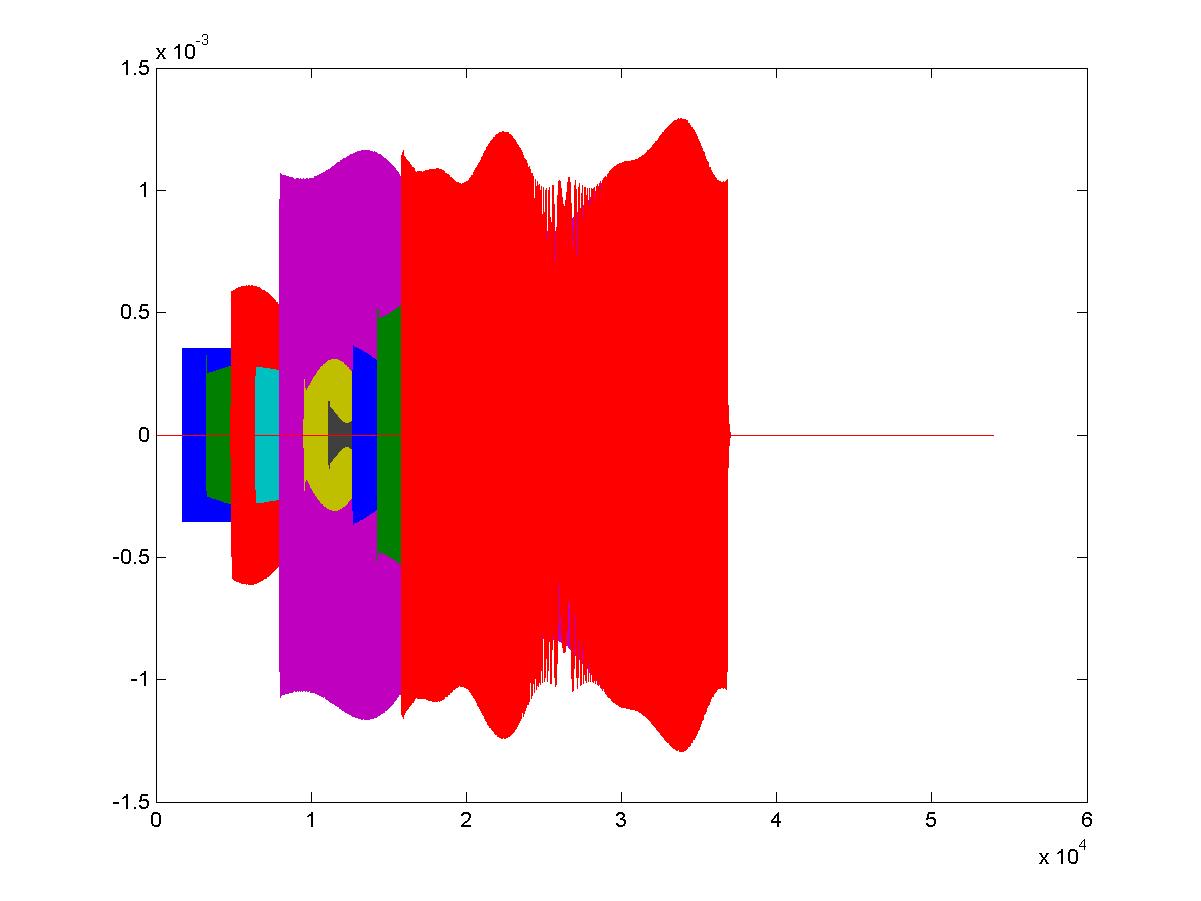 Receiver time-series at 10 ranges (2, 4, ..., 20 km) and for a receiver (a
whale) at a depth of 50 m (calculated by BELLHOP).
Receiver time-series at 10 ranges (2, 4, ..., 20 km) and for a receiver (a
whale) at a depth of 50 m (calculated by BELLHOP).
Receiver waveforms in 'wav' format. Output gain has been increased by 50 dB so that all waveforms have a reasonable amplitude.
Matlab file containing a single matrix with all the receiver time series. Scaling corresponds to a 230 dB source.